Original content is not easy. If you want to repost this article, please contact the staff and note the source of the reposted article; otherwise, infringement will be handled!
1. Preparation
1. Prepare a bag of fresh high-purity hydrogen gas and a bag of high-purity carrier gas. The carrier gas should be the same as the one used in the gas chromatograph and use a different volume injection needle.
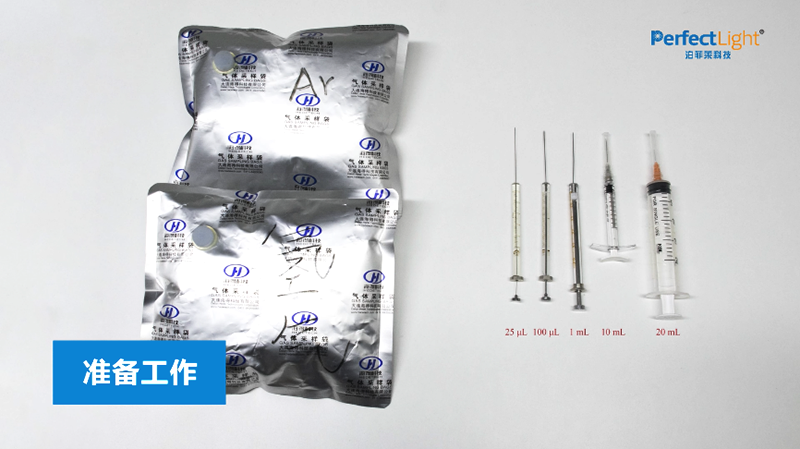
2. Labsolar-6A All-Glass Automatic Online Trace Gas Analysis System Preparatory Steps
(1) After conducting the photocatalytic hydrogen production from water decomposition experiment using the Labsolar-6A All-Glass Automatic Online Trace Gas Analysis System, turn off the xenon lamp light source and let it cool down;
(2) Turn off the magnetic stirrer;
(3) Click the exit button of the Labsolar-6A All-Glass Automatic Online Trace Gas Analysis System controller, confirm exiting the operation;
(4) Turn off the plunger pump switch, rotate the C1 and C₂ valves to the pipeline circulation;
(5) Turn on the vacuum pump, rotate the D valve to the vacuum state to evacuate the system.
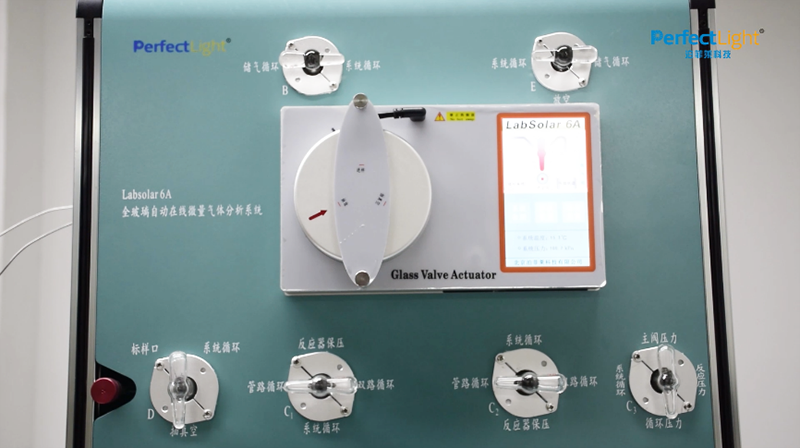
3. Early preparation work for the glass reactor
(1) Disconnect the condensate water pipeline from both ends of the glass reactor and short-circuit the condensate water pipeline;
(2) Take out the magnetic stirrer and place it stably aside. Hold the bottom of the glass reactor with one hand to prevent it from falling off. Use the other hand to remove the ball mill clamp at the connection of the glass reactor and the system. Then tilt the glass reactor at a large angle forward, remove the glass reactor, and place it steadily;
(3) Remove the chain clamp and reactor quartz optical window, and clean the glass reactor;
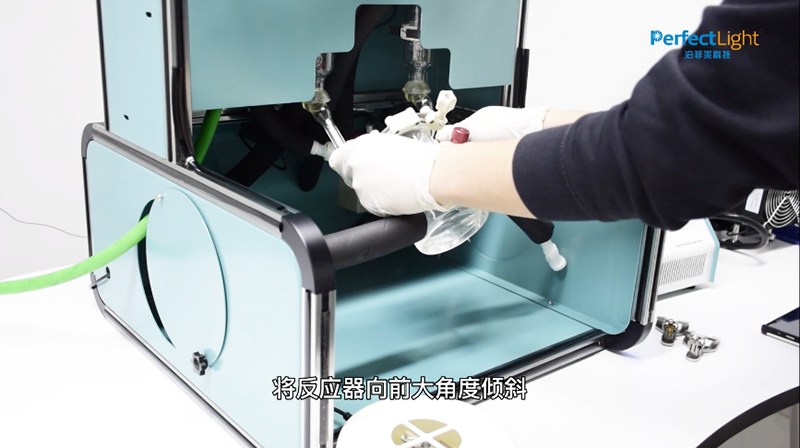
(4) Add the same components and volume of solution as in the previous photocatalytic hydrogen production from water decomposition experiment to the cleaned and dried glass reactor;
(5) Install the inner ring, sealing gasket, outer ring, and quartz optical window in order. Install the chain clamp according to the markings and tighten it;
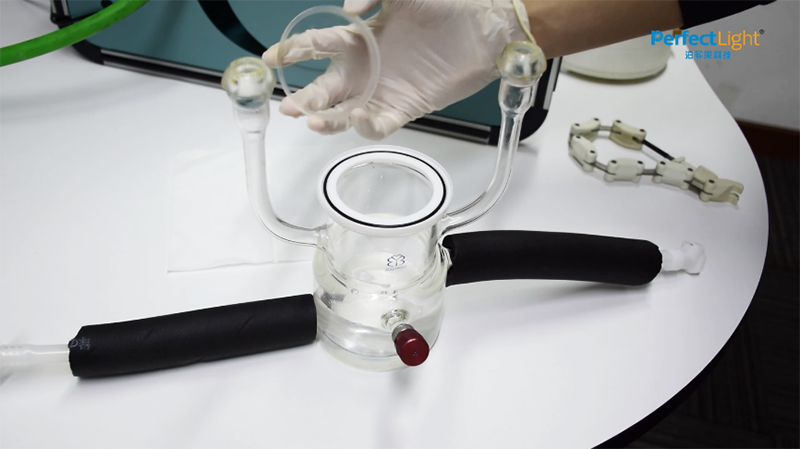
(6) Apply vacuum grease evenly on the ball mill heads at both ends of the glass reactor;
(7) Connect one end of the glass reactor to the Labsolar-6A All-Glass Automatic Online Trace Gas Analysis System pipeline, rotate it evenly, and remove it. Operate the other end in the same way, then connect both ends to the system simultaneously, and shake the glass reactor with the Labsolar-6A All-Glass Automatic Online Trace Gas Analysis System tightly combined; Note: Do not shake the glass reactor forcefully to avoid glass pipe breakage or solution entering the glass pipe!
(8) Clamp the ball mill clamp at both ends, place the magnetic stirrer at the bottom of the glass reactor;
(9) Reconnect the condensate water pipeline to the glass reactor. Note: Ensure that the condensate water temperature and magnetic stirrer speed are consistent with the previous photocatalytic hydrogen production from water decomposition experiment.
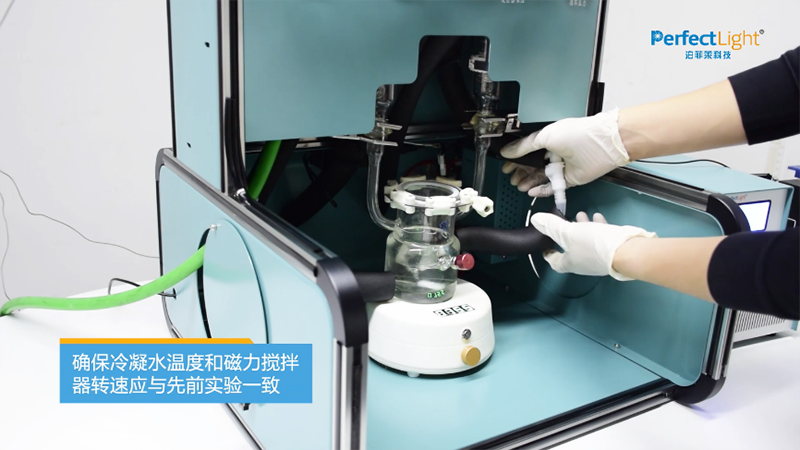
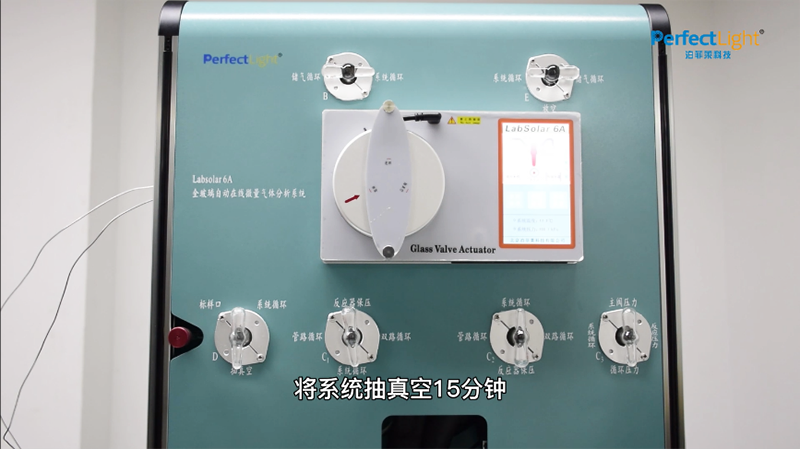
(10) Rotate the D valve to the vacuum state, the C1 valve to the system circulation state, and slowly rotate the C₂ valve to the system circulation state; Note: During the rotation of the C₂ valve, observe the bubbling status in the glass reactor to prevent boiling. If boiling occurs, you can first turn the C₂ valve to a position between system circulation and pipeline circulation and wait for the solution to stabilize before continuing the vacuum!
(11) Evacuate the Labsolar-6A All-Glass Automatic Online Trace Gas Analysis System for 15 minutes to ensure that all gases in the system are evacuated;
(12) Rotate the D valve to the system circulation.
4. Preliminary determination of the amount of standard gas added
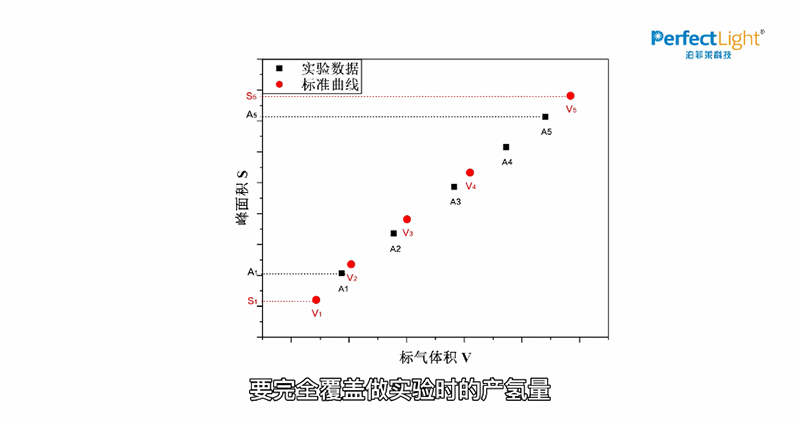
(1) Based on the hydrogen production amount in the previous photocatalytic hydrogen production from water decomposition experiment, i.e., the peak area of hydrogen detected by chromatography, preliminarily determine the amount of standard gas added to the Labsolar-6A All-Glass Automatic Online Trace Gas Analysis System. Set the hydrogen production amount in the previous experiment as A1, A₂, A₃, A₄, and A₅ per hour, respectively. When making the standard curve, you typically need 5 known standard gas volumes, denoted as V1, V₂, V₃, V₄, and V₅, with corresponding peak areas denoted as S1, S₂, S₃, S₄, and S₅;
(2) First, add the hydrogen gas corresponding to V1 to the Labsolar-6A All-Glass Automatic Online Trace Gas Analysis System. After uniform circulation, the detected peak area is S1. Compare the values of S1 and A1, and ensure that S1 < A1. If S1 ≥ A1, adjust the value of V1. Similarly, add the hydrogen gas corresponding to V₅-V1, detect S₅, and compare it with A₅. Ensure that S₅ > A₅. If S₅ ≤ A₅, adjust the value of V₅.
Note: The amount of hydrogen gas added must completely cover the hydrogen production amount in the experiment to ensure the accuracy of the standard curve!
2. Operating Procedure
1. Injecting Carrier Gas and Hydrogen Gas
(1) Use a 20 mL capacity injection needle to extract the carrier gas from the sample port of the Labsolar-6A All-Glass Automatic Online Trace Gas Analysis System;
Note: Before injecting gas, replace the gas inside the injection needle with clean air. Insert the injection needle into the gas bag and extract a portion of the carrier gas, then quickly remove it and completely push out the gas inside the injection needle. Repeat this process three times, and finally, extract 20 mL of carrier gas!
(2) Turn the D valve to the sample port state and inject the carrier gas into the Labsolar-6A All-Glass Automatic Online Trace Gas Analysis System from the sample port. Then, rotate the D valve back and forth between system circulation and the sample port 2-3 times to ensure that the carrier gas enters the system completely;
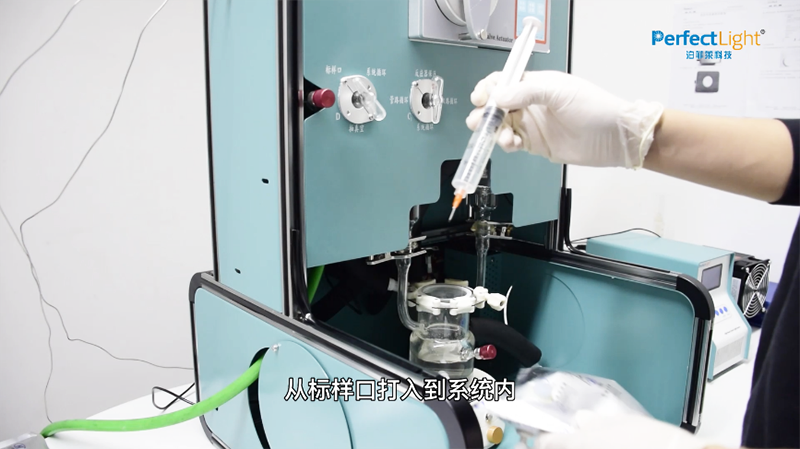
(3) Extract the hydrogen gas corresponding to V1, turn the D valve to the sample port, inject it into the system from the sample port, and then rotate the D valve back and forth between system circulation and the sample port 2-3 times to ensure that the hydrogen gas enters the system completely.
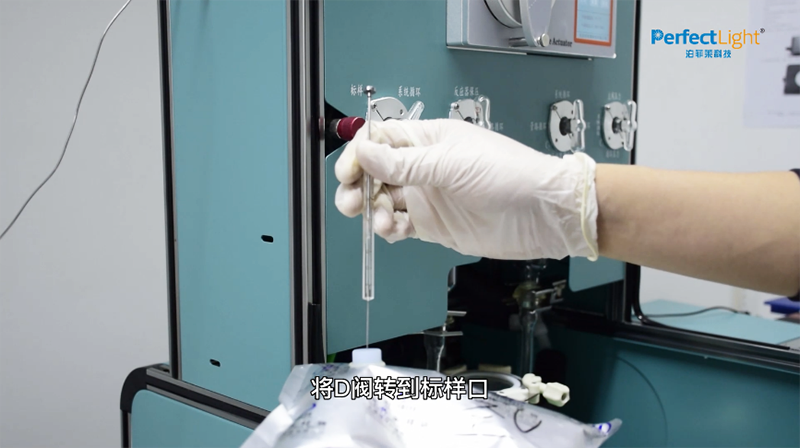
(4) Turn on the plunger pump power switch, wait for 20 minutes of circulation, and then start the system;
(5) Click on parameter settings, set the circulation time to 30 minutes to ensure that each injection can be circulated uniformly. You can set a longer operation cycle to ensure the experiment's smooth completion. After setting, click save;
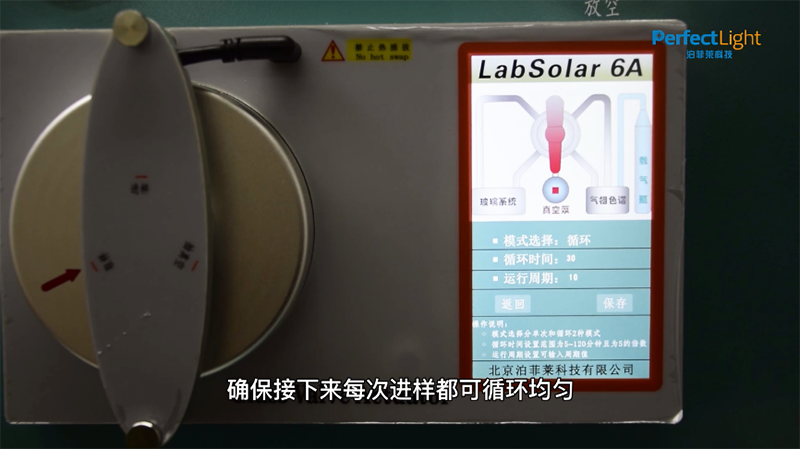
(6) Click run system. After the sample injection is complete and the A valve rotates to the sample state, you can inject the next amount of hydrogen gas into the Labsolar-6A All-Glass Automatic Online Trace Gas Analysis System, namely V₂-V1, V₃-V₂, V₄-V₃, and V₅-V₄, and obtain the peak areas S₂, S₃, S₄, and S₅.
2. Subsequent Operations
(1) After the standard curve experiment is completed, rotate the C1 and C₂ valves to the pipeline circulation state;
(2) Turn on the vacuum pump, rotate the D valve to the vacuum state, wait for the system to be completely evacuated, then rotate the D valve to the system circulation;
(3) Follow the correct procedures described above to close the system, remove and clean the reactor, install the ball mill plug at the mouth of the Labsolar-6A All-Glass Automatic Online Trace Gas Analysis System, clamp the ball mill, and prevent dust from entering the system.
3. Drawing the Hydrogen Standard Curve
1. Data Processing
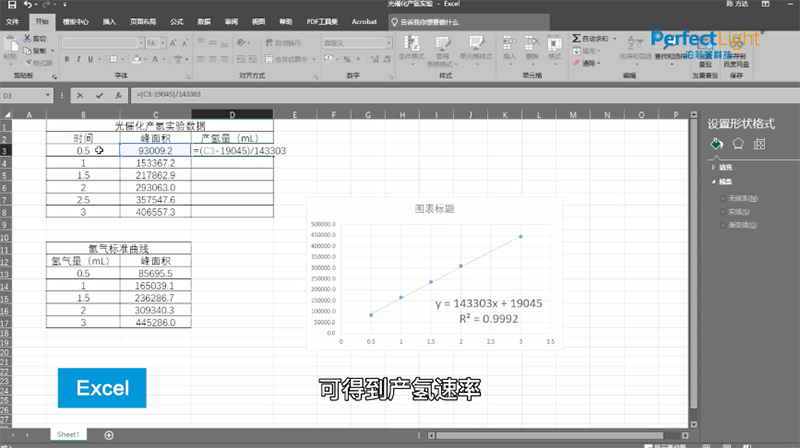
Plot a curve with hydrogen gas volume V as the x-axis and chromatographic peak area S as the y-axis, i.e., the raw data points of the standard curve. After linear fitting using Excel, you can obtain the standard curve with the linear equation y = ax + b and R2 displayed in the graph. In the equation, x represents the hydrogen gas volume, and y represents the peak area.
Note: The goodness of fit of the standard curve should have R2 ≥ 0.999. If R2 < 0.999, you need to remake the standard curve!

(2) Substitute the peak area obtained from the photocatalytic hydrogen production experiment into the linear equation y = ax + b, and you can calculate the volume of hydrogen gas generated;
(3) Using the formula n = V/Vm, where Vm = 22.414 L/mol, you can calculate the amount of substance generated, and then divide it by the reaction time to obtain the corresponding hydrogen production rate, in μmol·h-1 or mmol·h-1.

The above section is a translation and summary of the reference literature. My abilities are limited, so if there are any errors, please feel free to correct them!