Original content is not easy, if you reproduce this article, please contact the staff and indicate the source of the information in the reproduced article, otherwise it will be treated as infringement!
1. Preparations
1. Prepare a bag of fresh high-purity hydrogen gas and a bag of high-purity carrier gas. The carrier gas should be the same as the one used in the gas chromatograph and with a different volume injection needle.
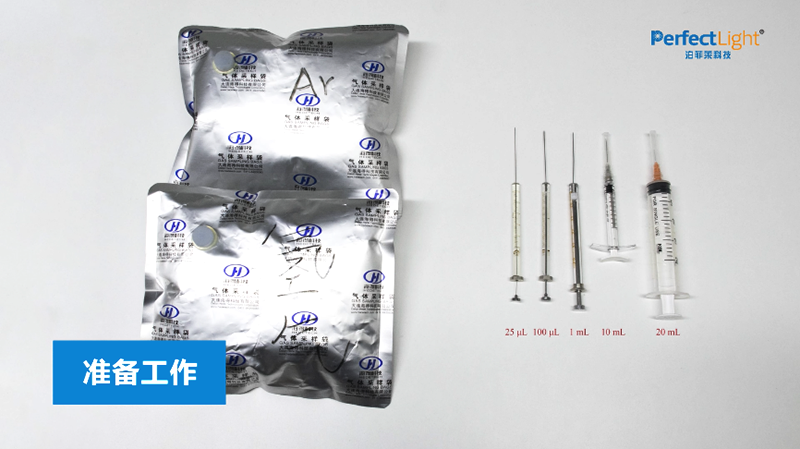
2. Preparations for the Labsolar-6A All-Glass Automatic Online Trace Gas Analysis System
(1) After conducting photocatalytic hydrogen production experiment using the Labsolar-6A All-Glass Automatic Online Trace Gas Analysis System, turn off the xenon lamp light source and set it aside to cool;
(2) Turn off the magnetic stirrer;
(3) Click the exit button on the controller of the Labsolar-6A All-Glass Automatic Online Trace Gas Analysis System to confirm the exit from operation;
(4) Turn off the plunger pump switch, rotate the C1 and C₂ valves to the pipeline circulation position;
(5) Turn on the vacuum pump, rotate the D valve to the vacuum state, and evacuate the system.
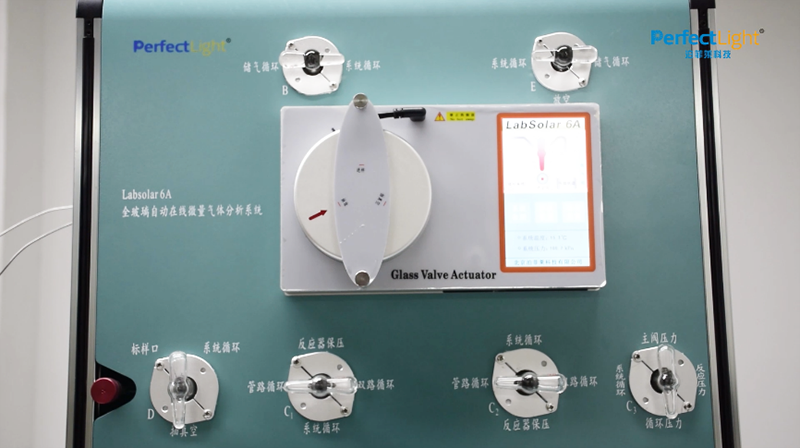
3. Preparations for the glass reactor
(1) Disconnect the condensation water pipeline from the ends of the glass reactor and short-circuit the condensation water pipeline;
(2) Take out the magnetic stirrer and place it steadily aside, hold the bottom of the glass reactor with one hand to prevent the glass reactor from falling, use the other hand to remove the ball mill clamp at the connection between the glass reactor and the system, then tilt the glass reactor at a large angle, take off the glass reactor, and place it steadily;
(3) Remove the chain clamp and the reactor's quartz window, and clean the glass reactor;
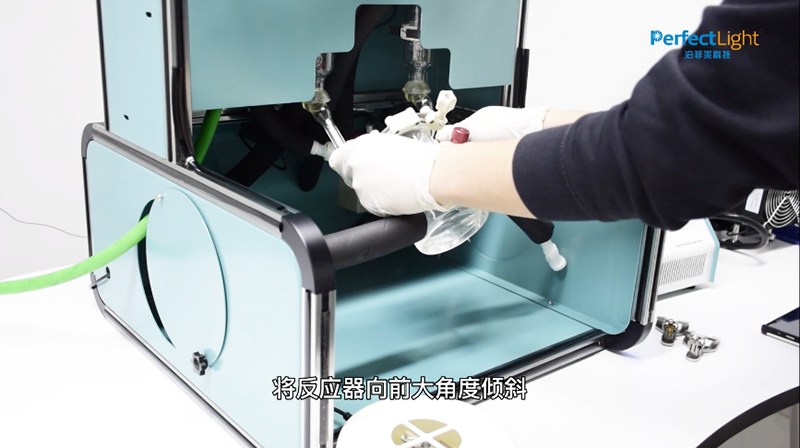
(4) Add the solution with the same composition and volume as in the previous photocatalytic hydrogen production experiment into the cleaned and dried glass reactor;
(5) Install the inner ring, sealing rubber ring, outer ring, and quartz window in order, and install the chain clamp according to the labels and tighten it;
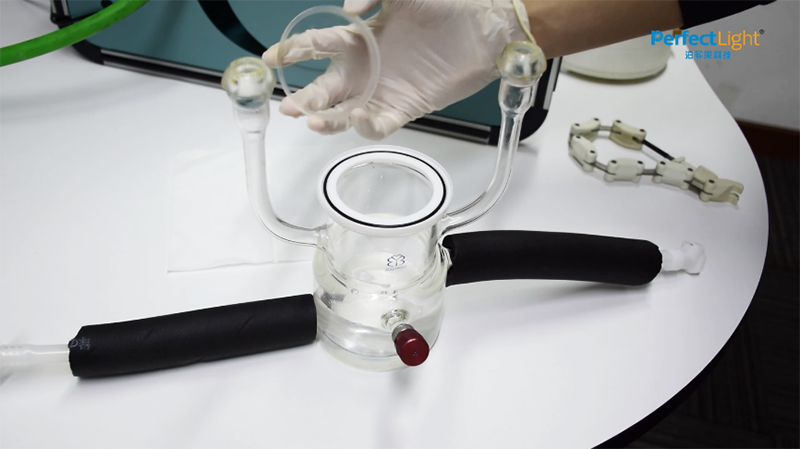
(6) Apply vacuum grease evenly on the ball mill heads at both ends of the glass reactor;
(7) Connect one end of the glass reactor to the pipeline of the Labsolar-6A All-Glass Automatic Online Trace Gas Analysis System, rotate it evenly, and remove it. Perform the same operation on the other end and then connect both ends to the system, shake them back and forth to tightly combine the glass reactor with the Labsolar-6A All-Glass Automatic Online Trace Gas Analysis System; Note: Do not shake the glass reactor forcefully to avoid breaking the glass pipeline or allowing solution to enter the glass pipeline!
(8) Clamp both ends with ball mill clamps, place the magnetic stirrer at the bottom of the glass reactor;
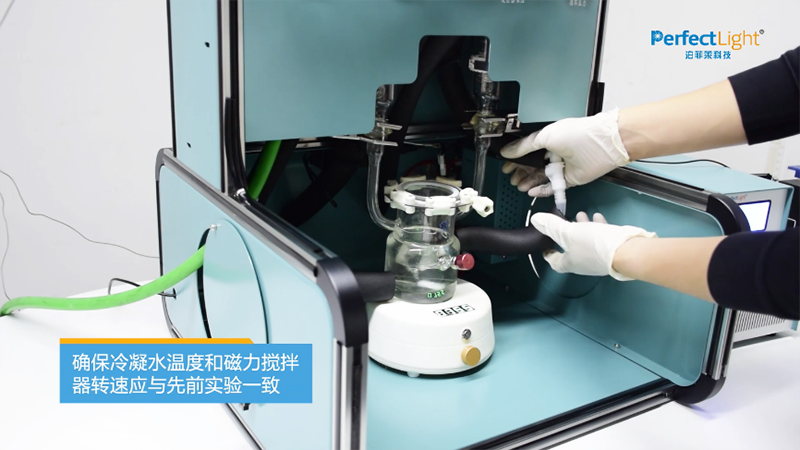
(9) Reconnect the condensation water pipeline to the glass reactor. Note: Ensure that the condensation water temperature and magnetic stirrer speed are consistent with the previous photocatalytic hydrogen production experiment.
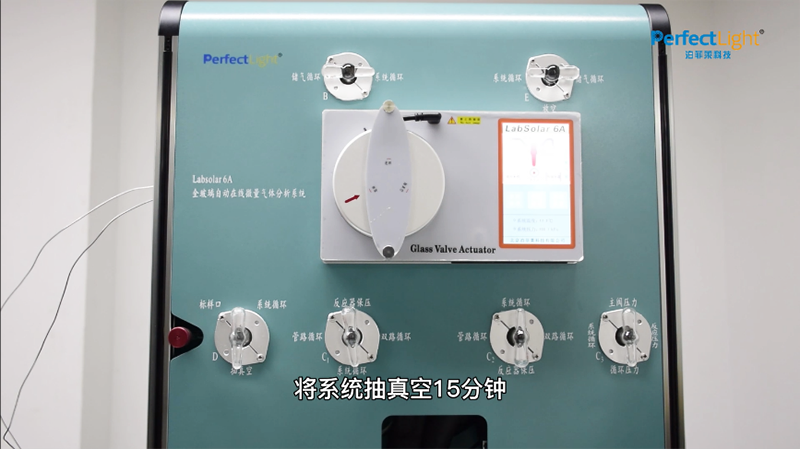
(10) Rotate the D valve to the vacuum state, rotate the C1 valve to the system circulation state, and slowly rotate the C₂ valve to the system circulation state; Note: Observe the bubbling state of the solution inside the glass reactor while rotating the C₂ valve to prevent violent boiling. If violent boiling occurs, you can first switch the C₂ valve between system circulation and pipeline circulation until the solution stabilizes, then continue with the vacuum!
(11) Evacuate the Labsolar-6A All-Glass Automatic Online Trace Gas Analysis System for 15 minutes to ensure that the gases in the system are thoroughly evacuated;
(12) Rotate the D valve to the system circulation.
4. Preliminary determination of the amount of standard gas added
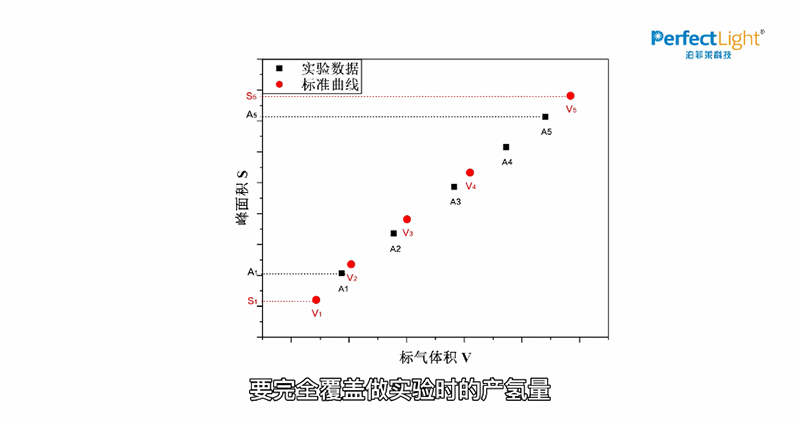
(1) Based on the hydrogen production in the previous photocatalytic water splitting experiments, which was determined by the peak area of detected hydrogen gas in chromatography, the initial amount of standard gas added to the Labsolar-6A all-glass automatic online trace gas analysis system is preliminarily determined. The hydrogen production in the previous experiments is denoted as A1, A₂, A₃, A₄, and A₅, respectively, per hour. When creating the standard curve, usually 5 known gas volumes are required, denoted as V1, V₂, V₃, V₄, and V₅, and their corresponding peak areas are noted as S1, S₂, S₃, S₄, and S₅, respectively;
(2) First, inject hydrogen gas with volume V1 into the Labsolar-6A all-glass automatic online trace gas analysis system. After achieving uniform circulation, the detected peak area in chromatography is S1. Compare the values of S1 and A1. Ensure that S1<A1. If S1 ≥ A1, then adjust the value of V1. Using the same method, inject hydrogen gas with volume V₅ - V1, detect S₅, and compare the values of S₅ and A₅. Ensure that S₅ > A₅. If S₅ ≤ A₅, then adjust the value of V₅;
Note: The amount of hydrogen gas added must completely cover the hydrogen production during the experiment to ensure the accuracy of the standard curve!
II. Operational Procedure
1. Injecting Carrier Gas and Hydrogen Gas
(1) Use a 20 mL sample needle to extract the carrier gas and inject it into the Labsolar-6A all-glass automatic online trace gas analysis system sample port;
Note: Before gas injection, replace the gas inside the sample needle. Insert the sample needle into the gas bag and extract a portion of the carrier gas. Then quickly pull out the needle and completely push out the gas in the sample needle. Repeat this process three times, and finally extract 20 mL of carrier gas!
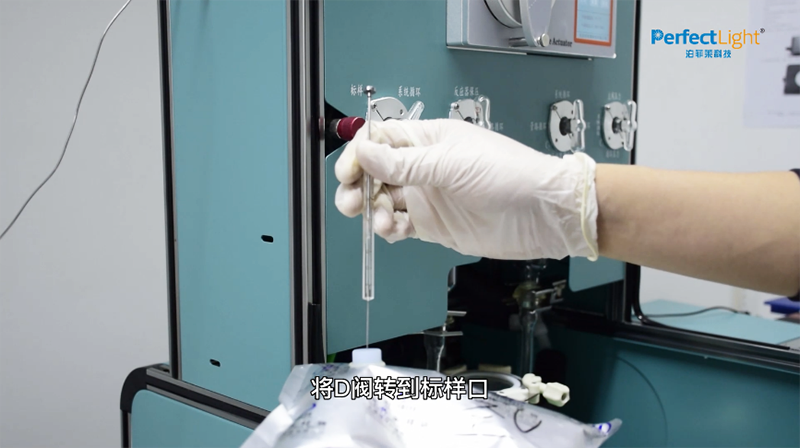
(2) Turn the D valve to the sample port state and inject the carrier gas into the Labsolar-6A all-glass automatic online trace gas analysis system from the sample port. Then, rotate the D valve 2-3 times between the system circulation and the sample port to ensure that the carrier gas is completely injected into the system;
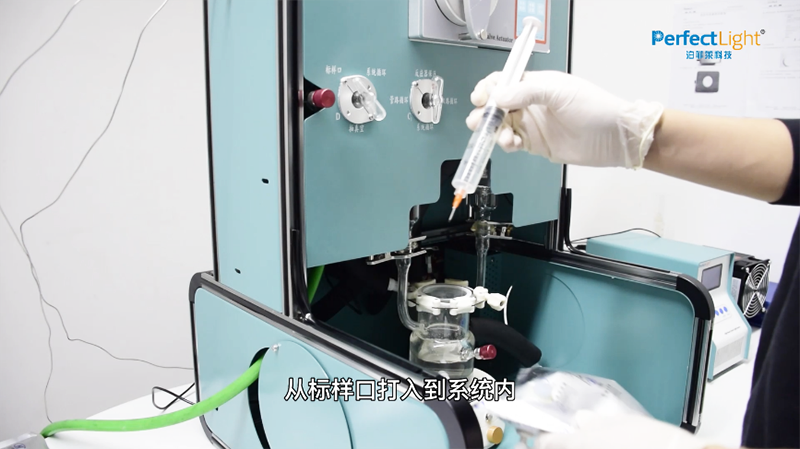
(3) Extract hydrogen gas with volume V1. Turn the D valve to the sample port, inject the hydrogen gas into the system from the sample port, and then rotate the D valve 2-3 times between the system circulation and the sample port to ensure that the hydrogen gas is completely injected into the system.
(4) Turn on the plunger pump power switch, wait for 20 minutes of circulation, and then start the system;
(5) Click on parameter settings, set the circulation time to 30 minutes to ensure uniform circulation for subsequent injections. You can set a longer run cycle to ensure the smooth completion of the experiment. After setting, click save;
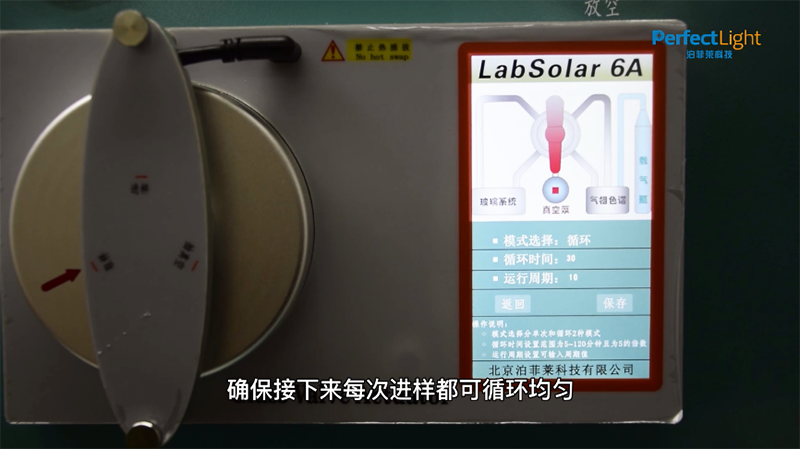
(6) Click run system. After the sample injection is complete and the A valve is rotated to the sample injection state, you can inject the next volume of hydrogen gas into the Labsolar-6A all-glass automatic online trace gas analysis system. These volumes are V₂ - V1, V₃ - V₂, V₄ - V₃, and V₅ - V₄, and the obtained peak areas are S₂, S₃, S₄, and S₅, respectively.
2. Subsequent Operations
(1) After the standard curve creation experiment is completed, rotate the C1 and C₂ valves to the pipeline circulation state;
(2) Turn on the vacuum pump, turn the D valve to the vacuum state, wait for the system to completely evacuate, and then turn the D valve to the system circulation;
(1) Based on the hydrogen production in the previous photocatalytic water splitting experiments, which was determined by the peak area of detected hydrogen gas in chromatography, the initial amount of standard gas added to the Labsolar-6A all-glass automatic online trace gas analysis system is preliminarily determined. The hydrogen production in the previous experiments is denoted as A1, A₂, A₃, A₄, and A₅, respectively, per hour. When creating the standard curve, usually 5 known gas volumes are required, denoted as V1, V₂, V₃, V₄, and V₅, and their corresponding peak areas are noted as S1, S₂, S₃, S₄, and S₅, respectively;
(2) First, inject hydrogen gas with volume V1 into the Labsolar-6A all-glass automatic online trace gas analysis system. After achieving uniform circulation, the detected peak area in chromatography is S1. Compare the values of S1 and A1. Ensure that S1<A1. If S1 ≥ A1, then adjust the value of V1. Using the same method, inject hydrogen gas with volume V₅ - V1, detect S₅, and compare the values of S₅ and A₅. Ensure that S₅ > A₅. If S₅ ≤ A₅, then adjust the value of V₅;
Note: The amount of hydrogen gas added must completely cover the hydrogen production during the experiment to ensure the accuracy of the standard curve!

II. Operational Procedure
1. Injecting Carrier Gas and Hydrogen Gas
(1) Use a 20 mL sample needle to extract the carrier gas and inject it into the Labsolar-6A all-glass automatic online trace gas analysis system sample port;
Note: Before gas injection, replace the gas inside the sample needle. Insert the sample needle into the gas bag and extract a portion of the carrier gas. Then quickly pull out the needle and completely push out the gas in the sample needle. Repeat this process three times, and finally extract 20 mL of carrier gas!
(2) Turn the D valve to the sample port state and inject the carrier gas into the Labsolar-6A all-glass automatic online trace gas analysis system from the sample port. Then, rotate the D valve 2-3 times between the system circulation and the sample port to ensure that the carrier gas is completely injected into the system;

(3) Extract hydrogen gas with volume V1. Turn the D valve to the sample port, inject the hydrogen gas into the system from the sample port, and then rotate the D valve 2-3 times between the system circulation and the sample port to ensure that the hydrogen gas is completely injected into the system.

(4) Turn on the plunger pump power switch, wait for 20 minutes of circulation, and then start the system;
(5) Click on parameter settings, set the circulation time to 30 minutes to ensure uniform circulation for subsequent injections. You can set a longer run cycle to ensure the smooth completion of the experiment. After setting, click save;

(6) Click run system. After the sample injection is complete and the A valve is rotated to the sample injection state, you can inject the next volume of hydrogen gas into the Labsolar-6A all-glass automatic online trace gas analysis system. These volumes are V₂ - V1, V₃ - V₂, V₄ - V₃, and V₅ - V₄, and the obtained peak areas are S₂, S₃, S₄, and S₅, respectively.
2. Subsequent Operations
(1) After the standard curve creation experiment is completed, rotate the C1 and C₂ valves to the pipeline circulation state;
(2) Turn on the vacuum pump, turn the D valve to the vacuum state, wait for the system to completely evacuate, and then turn the D valve to the system circulation;
(3) Follow the correct procedure mentioned above to shut down the system, remove and clean the reactor. Install the grinding stopper at the grinding port of the Labsolar-6A all-glass automatic online trace gas analysis system, clamp the grinding clamp, and prevent dust from entering the system;
III. Hydrogen Standard Curve Construction
1. Data Processing
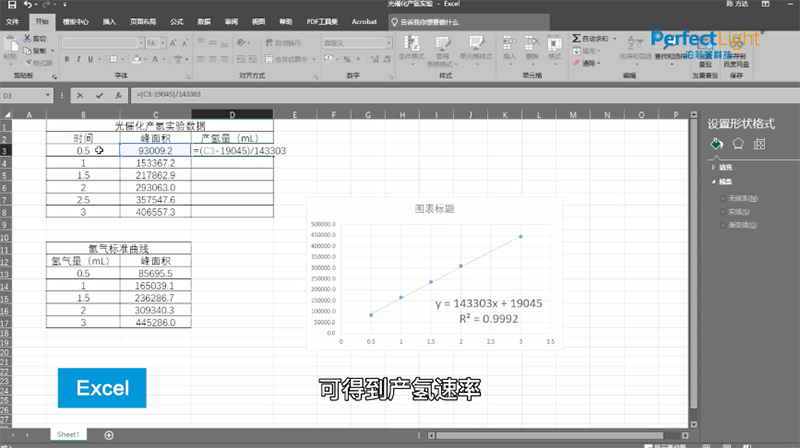
Plot a curve chart with hydrogen gas volume V as the horizontal axis and chromatographic peak area S as the vertical axis. These are the original data points of the standard curve. After performing linear fitting using Excel, the standard curve can be obtained.

(1) Enter the hydrogen gas intake volume and peak area values into the table. Select all the data, go to the menu bar, click "Insert" → "Scatter Plot," select any data point in the graph, right-click, and choose "Add Trendline." In the "Format Trendline" section that appears on the right, check "Display Equation" and "Display R-squared value." After checking these options, the linear equation y=ax+b and R2 of the standard curve will be displayed in the graph. In the equation, x represents the hydrogen gas volume, and y represents the peak area;
Note: The goodness of fit for the standard curve requires R2 ≥ 0.999. If R2 < 0.999, it is necessary to remake the standard curve!

(2) Substitute the peak area obtained from the photocatalytic water splitting hydrogen production experiment into the linear equation y=ax+b. This will yield the volume of hydrogen gas produced;
(3) Using the formula n=V/Vm, where Vm = 22.414 L/mol, calculate the amount of hydrogen gas substance produced. Then, divide by the reaction time to obtain the corresponding hydrogen production rate in units of μmol· h-1 or mmol· h-1;

The above sections are translated and summarized by the author based on the reference materials. The author's proficiency is limited. If there are any errors, please feel free to point them out!